A rent versus buy calculator with extra options
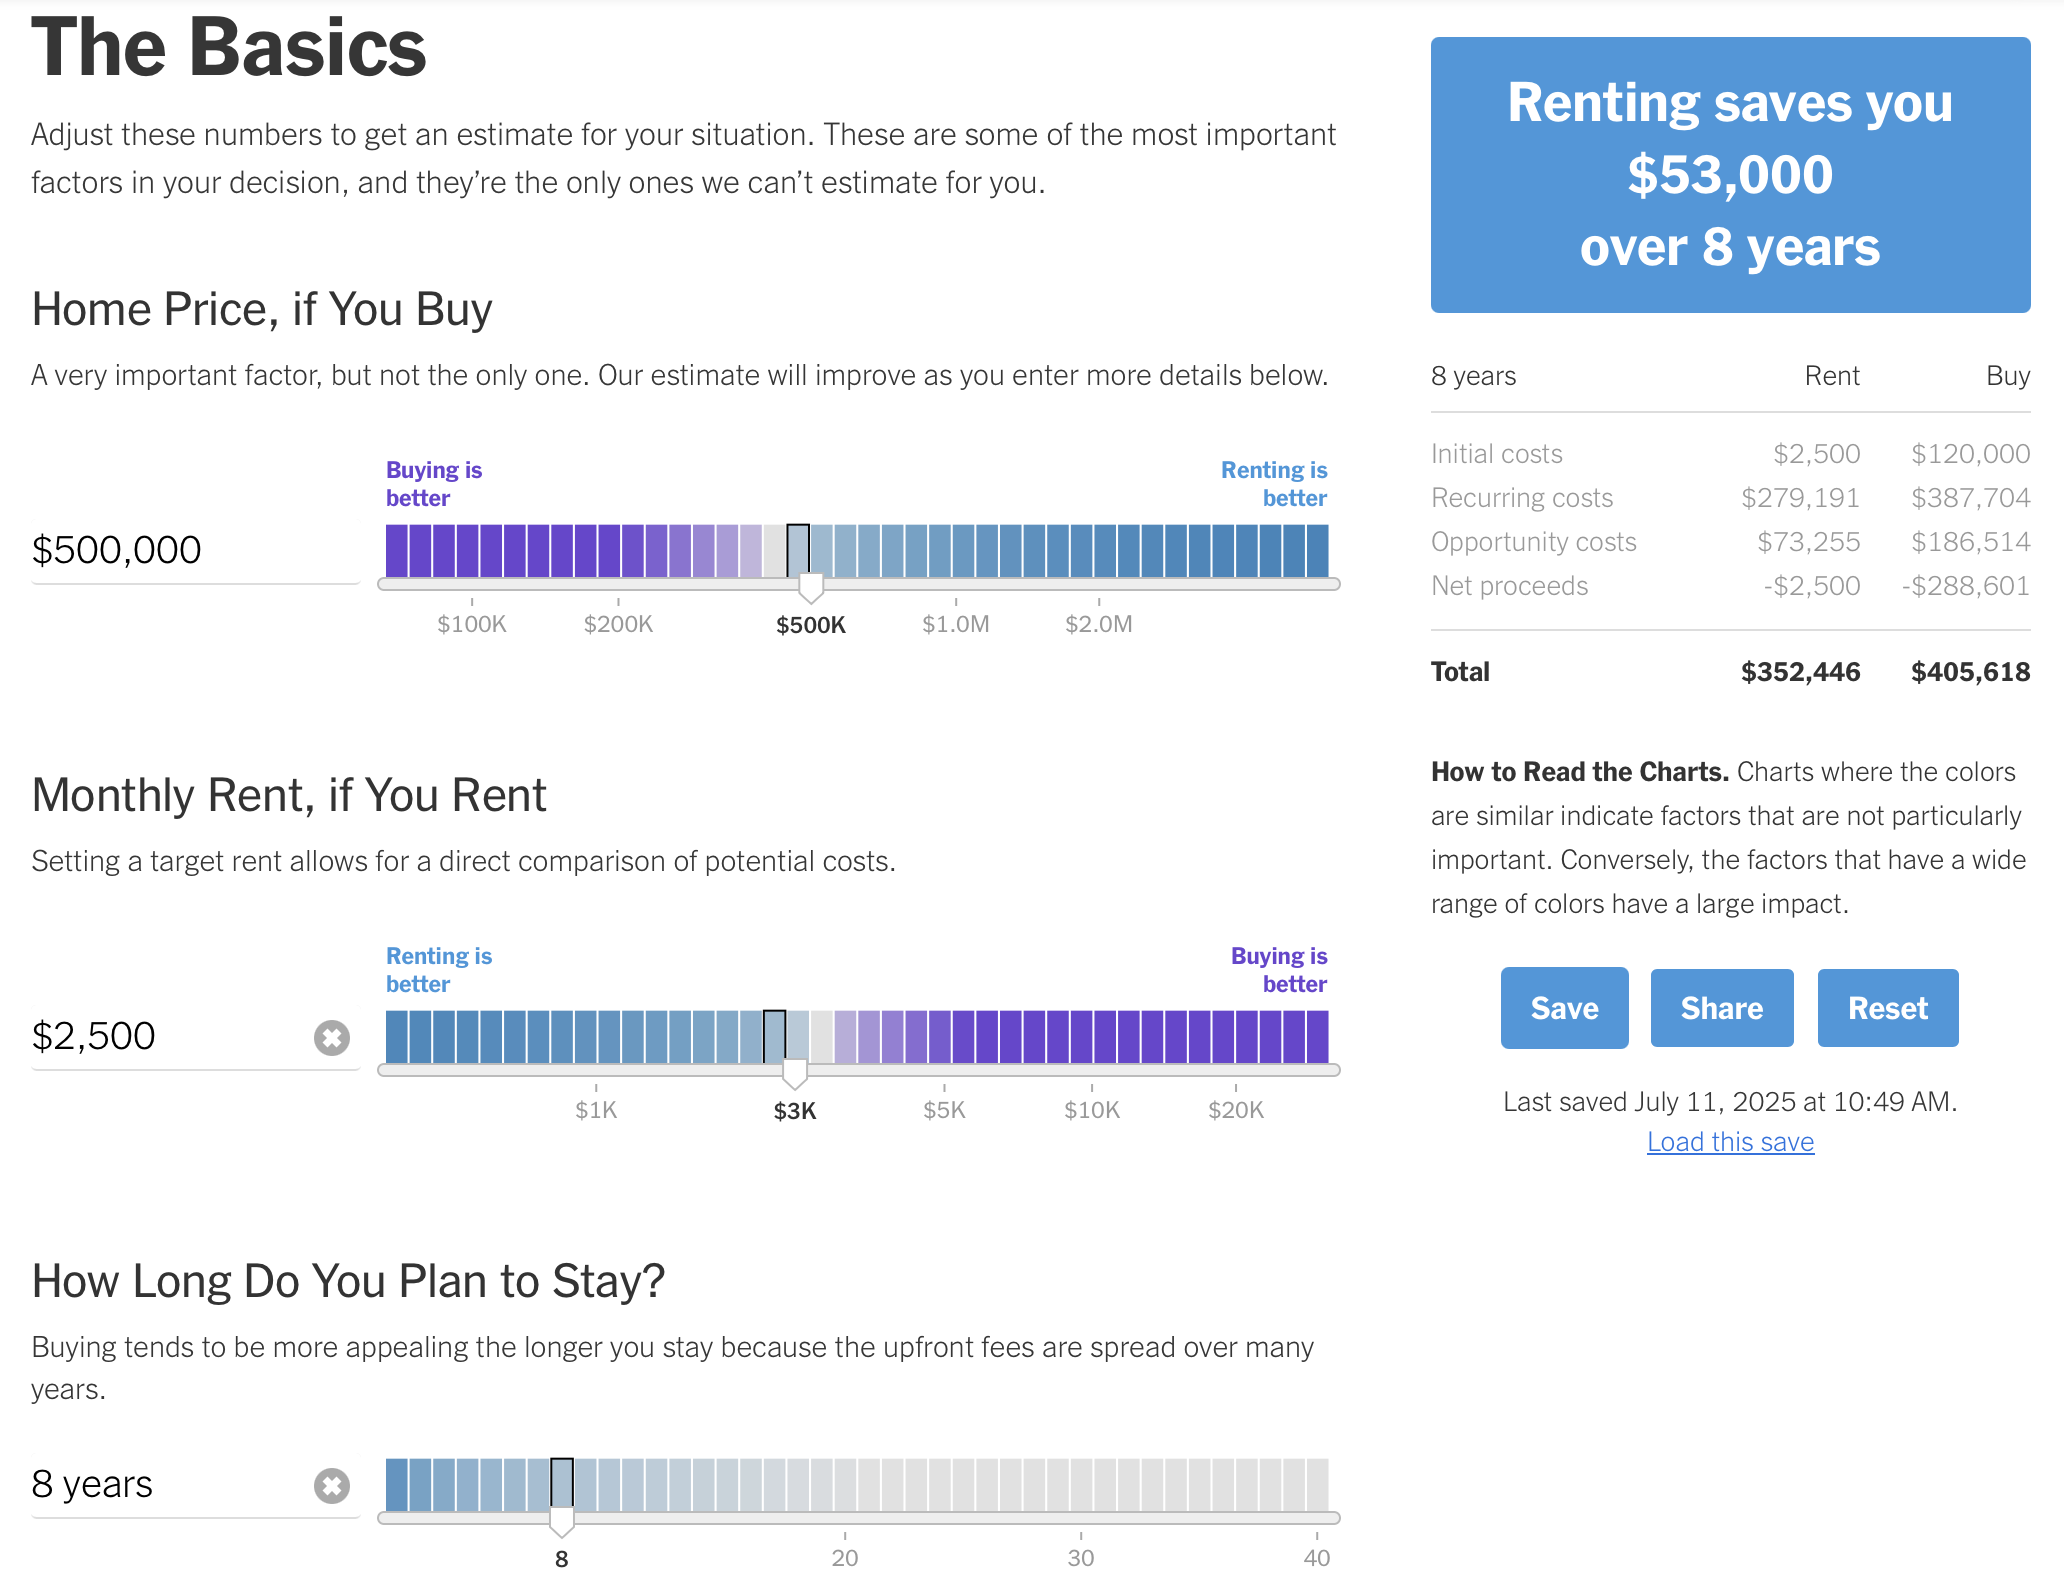
I’m a big fan of the New York Times’ rent versus buy calculator - it’s got an intuitive UI, it has sane defaults, and it does lots of annoying minor calculations for you (like determining the mortgage interest deduction on your taxes).

That said, it has a few shortcomings:
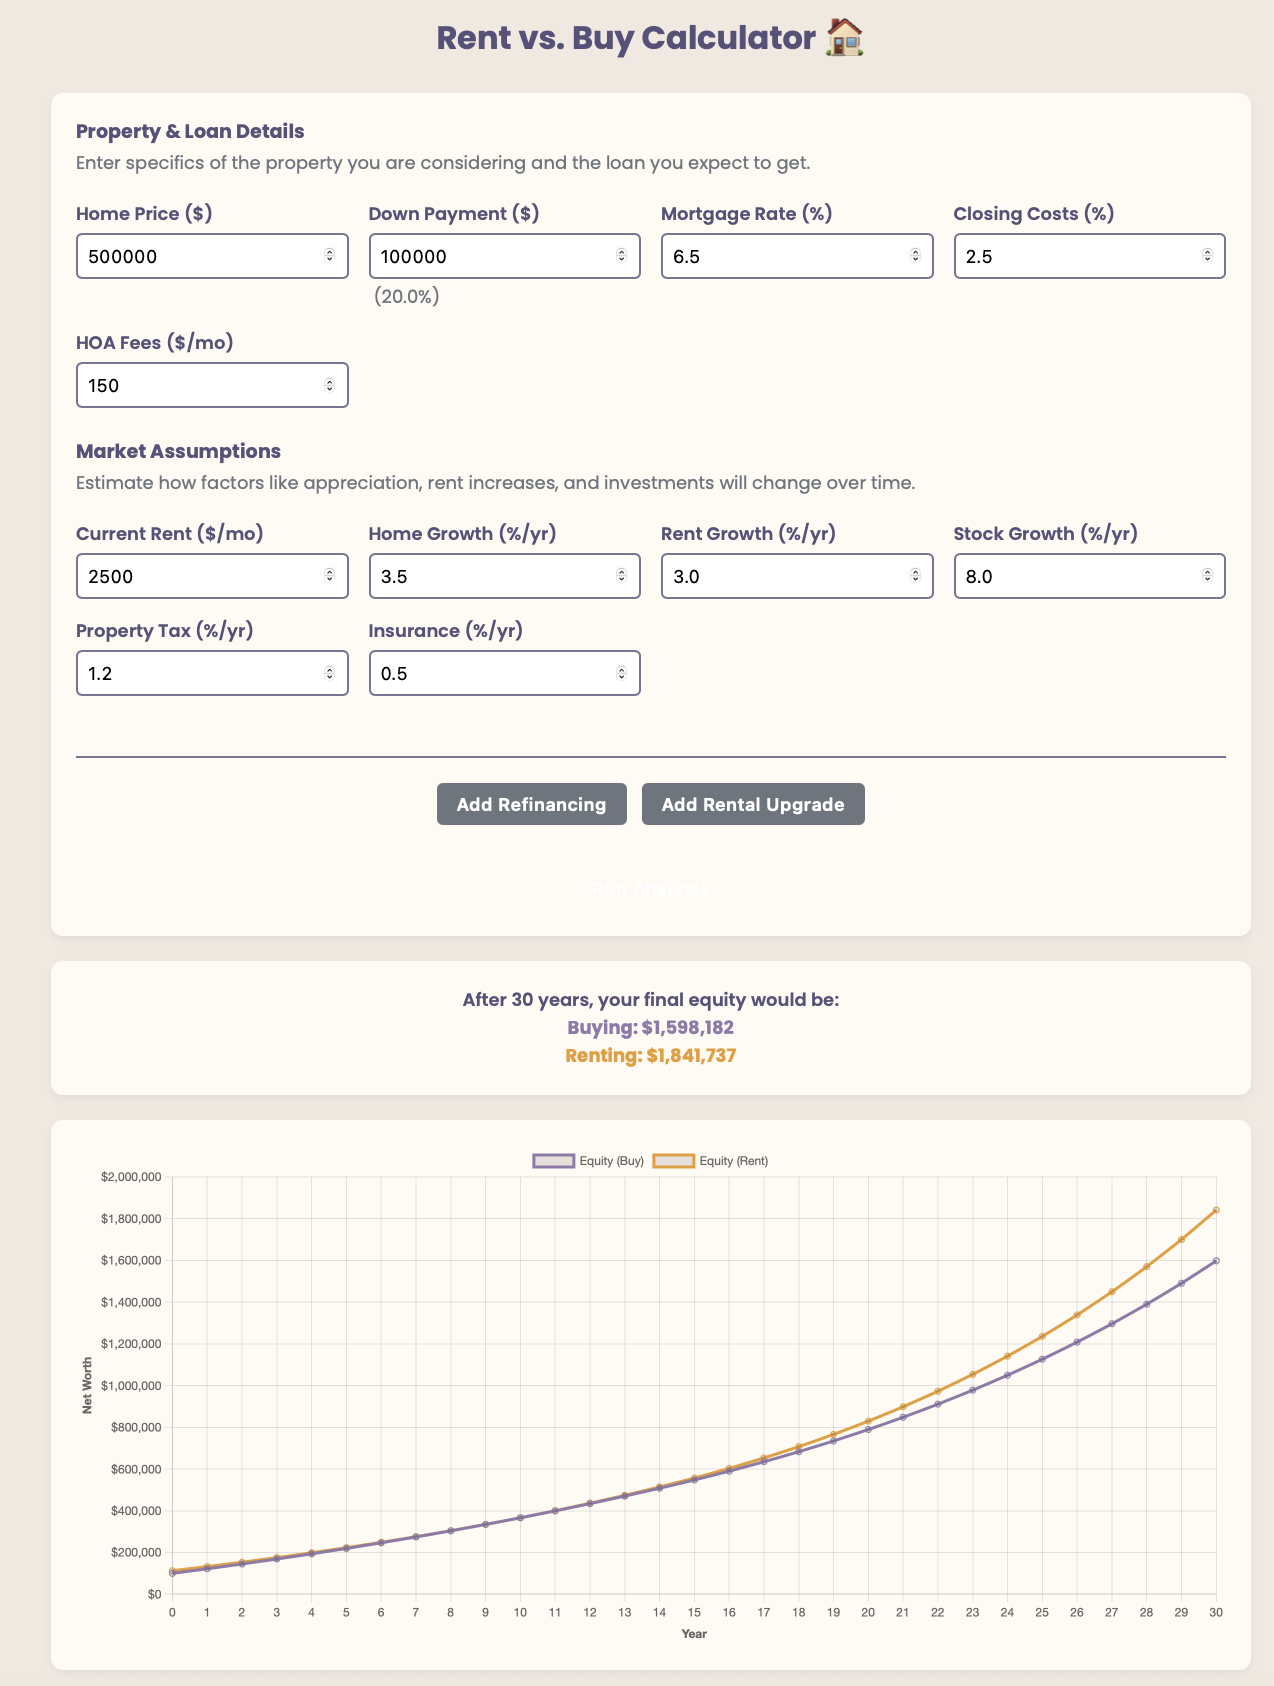
- It only presents the results at a single point in time (say, after 8 years). But it’s hard to plan 8 years ahead for just about anything! I would prefer to be able to see multiple years at a time, in a single graph.
- It isn’t easy to account for situations where you might move to a larger rental, or might refinance to take advantage of lower interest rates. You might rent a 1 bedroom apartment for now - and maybe that’ll be fine for the next 3 or 4 years, but then you plan on moving in with a partner and want a second bedroom. Do you put in your current rent? The rent for a two-bedroom? Some sort of weighted average rent? I can’t imagine this is an uncommon scenario; in fact, I would bet among 20- and 30-somethings, it’s probably the norm. In addition, mortgage interest rates are at a historic high as of this writing (September 2025) relative to the last 25 years or so. It’s reasonable to assume that they might drop in the future - but what if you decide to refinance 10 years from now at a lower rate? Should you put in some sort of time-averaged interest rate to the calculator?
- The winner between buying and renting often comes down to just a couple percentage points in the assumptions for investment returns and home price growth rate. An average of 7% growth or 9% growth in the stock market can change your net worth by huge amounts. It would be nice to do a Monte Carlo simulation, given some distribution of growth rates, to get a better sense of the risks.
It turns out that making a Monte Carlo is a bit tricky (you have to start making assumptions on the structure of the covariance matrix of the different parameters, for instance). But the other two points are easy to fix, especially with ~vibe coding~. Here’s a simple web app I built to do the rent versus buy calculation that shows a graph of the results over time, and allows for refinancing and rental moves. It doesn’t get as in-depth as the New York Times with regards to taxes and some other minor expenses (like a rental security deposit). But perhaps it’s useful in its own way.

The repo is here - maybe I’ll add the Monte Carlo component if I get around to it. Or, feel free to add a PR!
A note on vibe coding
I was somewhat disappointed in the various AI tools I used to try to build this. I figured it was a pretty straightforward application that they should be able to one- or few-shot. But it took quite a bit of haranguing to get something that I trusted the output of.
Some mistakes made included:
- Mixing up payments and equity (i.e. the net worth of the renter would increase when I increased the rental price growth rate).
- Adding in unnecessary dependencies (returning a Pandas DataFrame of results when a simple dictionary would do just fine).
- Forgetting that punctuation marks in a Python string need to be escaped.
Now, it’s impressive that we can do this with AI at all - a few years ago, I’m sure that getting Pyodide to play nice would have been a headache and taken far longer to get something functional. But it’s just another vote for the 80/20 rule (getting AI to the point where it’s an 80% solution takes 20% of the work). There’s still a long way to go.
Enjoy Reading This Article?
Here are some more articles you might like to read next: